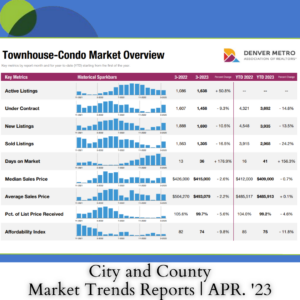
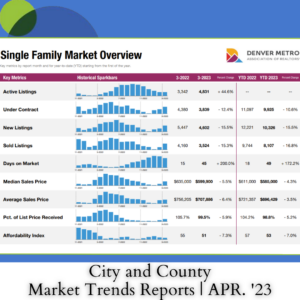
Percent changes calculated using year-over-year comparisons
New Listings were down 15.5 percent for single family homes and 10.5 percent for townhouse-condo properties. Under Contracts decreased 12.4 percent for single family homes and 9.3 percent for townhouse-condo propertiesю
The Median Sales Price was down 5.5 percent to $599,900 for single family homes and 2.6 percent to $415,000 for townhouse-condo properties. Days on Market increased 200.0 percent for single family homes and 176.9 percent for townhouse-condo properties.
Monthly sales might have been even higher if not for limited inventory nationwide. At the current sales pace, there were just 2.6 months’ supply of existing homes at the beginning of March, far below the 4-6 months’ supply of a balanced market. Inventory remains suppressed in part because of mortgage interest rates, which nearly hit 7% before falling again in recent weeks. Higher rates have continued to put downward pressure on sales prices, and for the first time in more than a decade, national home prices were lower year-over-year, according to NAR, breaking a 131-month streak of annual price increases.
Source: https://www.dmarealtors.com/