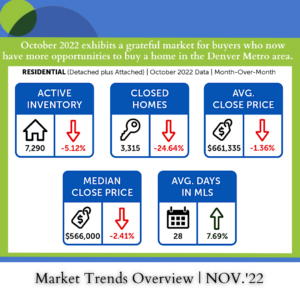
 As the Denver market normalizes, active inventory declined slightly to 7,290 homes on the market at month’s end. However, this is an increase of 115.94 percent year-over-year. While this number reads as a jump, the current inventory is still less than the pre-pandemic inventory numbers of 8,557 active listings in October 2019.
Rising inflation and interest rates are undoubtedly changing the landscape of the market, showcased in new listings, which declined 26.73 percent from last month and 27.92 year-over-year. As a result, Denver Metro saw its first small decline in average and median sales prices this month. However, sale prices skyrocketed over the last two years so as a result, the market is well ahead of historical appreciation metrics of where the Denver market should be had it not experienced a pandemic-fueled buying frenzy. Overall, while prices flatten out, the historical appreciation that sellers have seen cannot be ignored.
“There are opportunities to look at the silver lining of every scenario,” commented Libby Levinson-Katz, Chair of the DMAR Market Trends Committee and Metro Denver Realtor®. “This evolving marketplace allows buyers more options and the gift of time to decide on a home while negotiating terms that suit their needs. Meanwhile, sellers can analyze the marketplace to position their homes correctly while being able to experience a great return on investment due to rising prices over the last years. While the market changes, the past two years continue to represent the exception and not the rule. If one was to remove 2020 and 2021, the Denver Metro market trajectory is on pace with where it was predicted to be, had COVID-19 not happened.”
As prices adjust, the median days in the MLS continues to increase, up 240 percent from five days last year to 17 days this year. While this number continues to grow, many homes on the market are priced based on peak market activity, and are thus incorrectly priced for the current market. These homes have inflated prices which the market has rejected, and are thus increasing days in MLS. These properties were either finally withdrawn from the market or the prices were adjusted before ultimately selling.
Our monthly report also includes statistics and analyses in its supplemental “Luxury Market Report” (properties sold for $1 million or greater), “Signature Market Report” (properties sold between $750,000 and $999,999), “Premier Market Report” (properties sold between $500,000 and $749,999), and “Classic Market” (properties sold between $300,000 and $499,999).
In October, the Luxury Market saw the number of new listings and closings decrease dramatically, and the close-price-to-list-price ratio increase from the previous month.Throughout the month, listings decreased by 28.69 percent compared to the previous month.
There has always been seasonality in the market and a decrease in active listings is consistent with the past. The value of houses is about the relationship between supply and demand. While supply did drop dramatically, the amount of closed properties decreased by 31.52 percent compared to September.
The market shift changed the dynamic between sellers and buyers. Months of inventory for single-family detached properties is 3.43 and for attached properties is 3.08. The Luxury Market has the highest months of inventory out of any price point. This change shows that the demand for this type of property has proportionally decreased more than the supply. The increased months of inventory translated to buyers having more negotiation power with appraisal and inspection disagreements.
“While bidding wars are not as common, I had a client that had to compete on a million-dollar house that went above the asking price. Each listing will always dictate its own story,” said Andrew Abrams, DMAR Market Trends Committee member and Metro Denver Realtor®. “While buyers may think they have negotiation power in this market, many sellers are hesitant to drop their price too much, which is why the close-price-to-list-price ratio in October was 98.72 percent. November should represent a similar flow as October. Inventory decreasing, buyers being patient to find the right house and negotiations tough for both sides.”
Source: https://www.dmarealtors.com/